Computes the (signed) Maximum Absolute Deviation (MAD) of a path, defined by vectors of x and y coordinates, as compared to an ideal line passing through the start and end points.
Arguments
- x_vector
x-coordinates of the executed path.
- y_vector
y-coordinates of the executed path.
- x_start
x-coordinate of the start point of the ideal line. Defaults to the first value in
x_vector.- y_start
y-coordinate of the start point of the ideal line. Defaults to the first value in
y_vector.- x_end
x-coordinate of the end point of the ideal line. Defaults to the last value in
x_vector.- y_end
y-coordinate of the end point of the ideal line. Defaults to the last value in
y_vector.
Details
The ideal line is a line, not a line segment, i.e., it has infinite length. The supplied vectors are assumed to be ordered by time. Counterclockwise deviations from the ideal line are considered positive, clockwise deviations as negative for the computation of the MAD. Thus, negative MADs are possible. If more than one value is considered maximal, the first maximal value is returned.
References
Pfister, R., Tonn, S., Schaaf, M., Wirth, R. (2024). mousetRajectory: Mouse tracking analyses for behavioral scientists. The Quantitative Methods for Psychology, 20(3), 217-229. doi:10.20982/tqmp.20.3.p217
Examples
x_vals <- c(0, 0, 0, 1, 2)
y_vals <- c(0, 1, 2, 2, 2)
plot(x_vals, y_vals, type = "l")
lines(c(0, 2), c(0, 2), lty = "dashed", lwd = 2) # ideal
 max_ad(x_vals, y_vals) # counterclockwise deviation: positive
#> [1] 1.414214
x_vals <- c(0, 1, 2, 2, 2)
y_vals <- c(0, 0, 0, 1, 2)
plot(x_vals, y_vals, type = "l")
lines(c(0, 2), c(0, 2), lty = "dashed", lwd = 2) # ideal
max_ad(x_vals, y_vals) # counterclockwise deviation: positive
#> [1] 1.414214
x_vals <- c(0, 1, 2, 2, 2)
y_vals <- c(0, 0, 0, 1, 2)
plot(x_vals, y_vals, type = "l")
lines(c(0, 2), c(0, 2), lty = "dashed", lwd = 2) # ideal
 max_ad(x_vals, y_vals) # clockwise deviation: negative
#> [1] -1.414214
x_vals <- -x_vals
max_ad(x_vals, y_vals) # now it is counterclockwise again
#> [1] 1.414214
x_vals <- c(0, 0, 1, 2, 3, 6, 3)
y_vals <- c(0, 2, 2, 2, 2, 1, 0)
plot(x_vals, y_vals, type = "l")
lines(c(0, 3), c(0, 0), lty = "dashed", lwd = 2) # ideal
max_ad(x_vals, y_vals) # clockwise deviation: negative
#> [1] -1.414214
x_vals <- -x_vals
max_ad(x_vals, y_vals) # now it is counterclockwise again
#> [1] 1.414214
x_vals <- c(0, 0, 1, 2, 3, 6, 3)
y_vals <- c(0, 2, 2, 2, 2, 1, 0)
plot(x_vals, y_vals, type = "l")
lines(c(0, 3), c(0, 0), lty = "dashed", lwd = 2) # ideal
 max_ad(x_vals, y_vals) # the ideal trajectory has infinite length
#> [1] 2
x_vals <- c(0, 1, 2, 3)
y_vals <- c(0, 1, -1, 0)
plot(x_vals, y_vals, type = "l")
lines(x_vals, -y_vals, col = "red")
lines(c(0, 3), c(0, 0), lty = "dashed", lwd = 2) # ideal
max_ad(x_vals, y_vals) # the ideal trajectory has infinite length
#> [1] 2
x_vals <- c(0, 1, 2, 3)
y_vals <- c(0, 1, -1, 0)
plot(x_vals, y_vals, type = "l")
lines(x_vals, -y_vals, col = "red")
lines(c(0, 3), c(0, 0), lty = "dashed", lwd = 2) # ideal
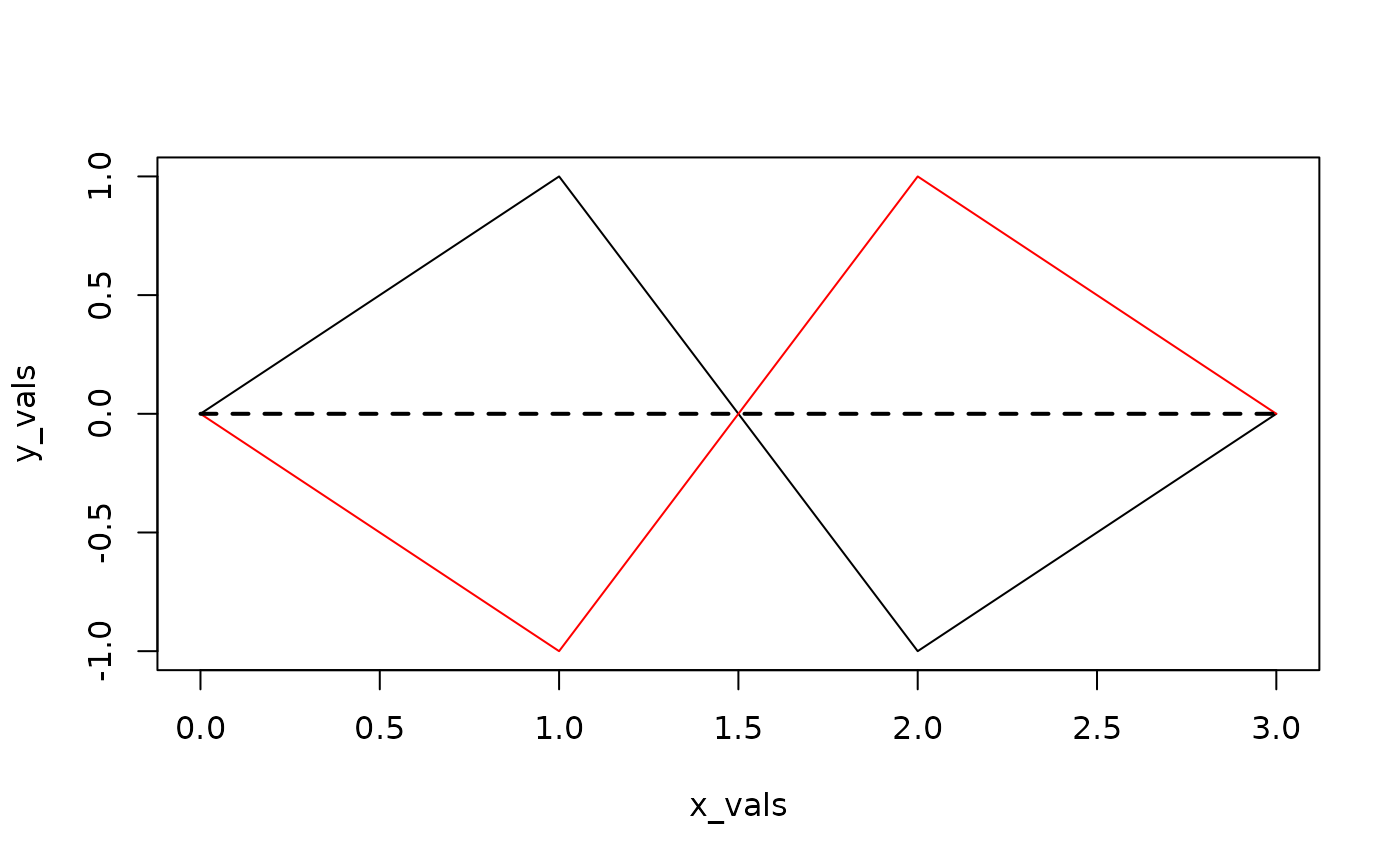 max_ad(x_vals, y_vals)
#> [1] 1
max_ad(x_vals, -y_vals) # the "first" maximal value is returned
#> [1] -1
max_ad(x_vals, y_vals)
#> [1] 1
max_ad(x_vals, -y_vals) # the "first" maximal value is returned
#> [1] -1